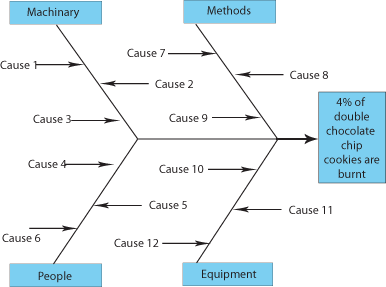
The cause and effect diagram is used to identify and discover all the potential or real causes (or inputs) that will lead to or result in a single effect (or output). The arrangement of the causes is done according to their level of importance or detail which results in a depiction of relationships and hierarchy of events.
It helps in finding the root causes, identifying the problematic areas and comparing the relative importance of different causes. It is also used to the organization diagramming, parts hierarchies, project planning, tree diagrams, and the 5 Why’s.
The C&E diagram is also famous as the fishbone diagram because it resembles the skeleton of a fish, with the main causes categories drawn as “bones” attached to the spine of the fish.
Chi-square test
A chi-square test (also chi-squared or ?2 test) is any statistical hypothesis test used to compare observed data with data we would expect to obtain according to a specific hypothesis and in which the sampling distribution of the test statistic is a chi-square distribution when the null hypothesis is true.
Chi-square test practices null hypothesis, which states that there is no significant difference between the expected and observed result in an event.
Some examples of chi-squared tests are Pearson’s chi-square test, Yates’ chi-square test, Mantel-Haenszel chi-square test, Linear-by-linear association chi-square test, The portmanteau test in time-series analysis, testing for the presence of autocorrelation.
Control Charts
The control chart, also known as the Shewhart chart or process-behaviour chart, is a tool used in statistical process control for determining whether a business process is in a state of statistical control or not. It is also known as a special-cause variation.
All points will be plotted within the control limits in case the process is in control,. Any observations outside the limits suggests the introduction of a source of variation which is new and unanticipated.
As increased variation means increased quality costs, a control chart revealing the presence of a special-cause calls for immediate investigation. Thus the control limits are a crucial decision aids. The control limits suggests about process behaviour .
Download :
