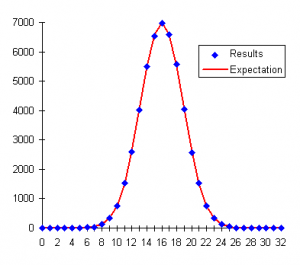
 A Chi Square test also called as Chi-squared is a statistical hypothesis test that has a chi-square distribution when the null hypothesis is true. This test is most commonly used to observe what results are obtained by comparing given data with the expected data. This test is conducted to prove that there will be no change or difference between actual & expected data. The Chi-Square formula is sum of the squared difference between the actual & expected data, divided by the expected data.
Important rules
It is necessary to follow two important rules while using Chi-Square formula. That is:
- Chi-Square has to be calculated using only numerical values & not percentage or ratios.
- Chi-Square should not be calculated if the expected value in any category is less than 5.
Examples of Chi-Square tests
Some of the most common examples of chi-squared tests that are used in Statistical analysis are :
- Pearson’s chi-square test
- Yates chi-square test
- Mantel-Haenszel chi-square test
- Linear-by-Linear association chi-square test
- Sample variance test.
Pearson’s test is also called as Goodness-of-Fit test or Test for Independence. It was first developed by Karl Pearson. This test is one of the most widely used chi-square method.
Like Pearson’s chi-square test, Yates chi-square test is another commonly & widely used test. Yates test is also called as Yates Correction for Continuity test, developed by Frank Yates. This formula helps in preventing over estimation of the data. This is mainly used when at least one data in the table has an expected frequency of less than 5.
Chi Square test is the most popular method of testing used to determine hypothesis of the data. This test consists of three different methods of analysis namely :
- Goodness of Fit
- Test for Homogeneity
- Test of Independence
Goodness of Fit test is performed to know whether or not there is any difference in frequency distribution when compared with theoretical distribution.
The test for Homogeneity is performed whether the data used to analyze are homogeneous or have similar characteristics.
Test of Independence is performed to know whether the two variables in a Contingency table are independent of each other or not when an paired observation is conducted.
Coaching Institutions
- Harvard Business School of India
- Indian Institute of Management
- Online Coaching.